The bottom line
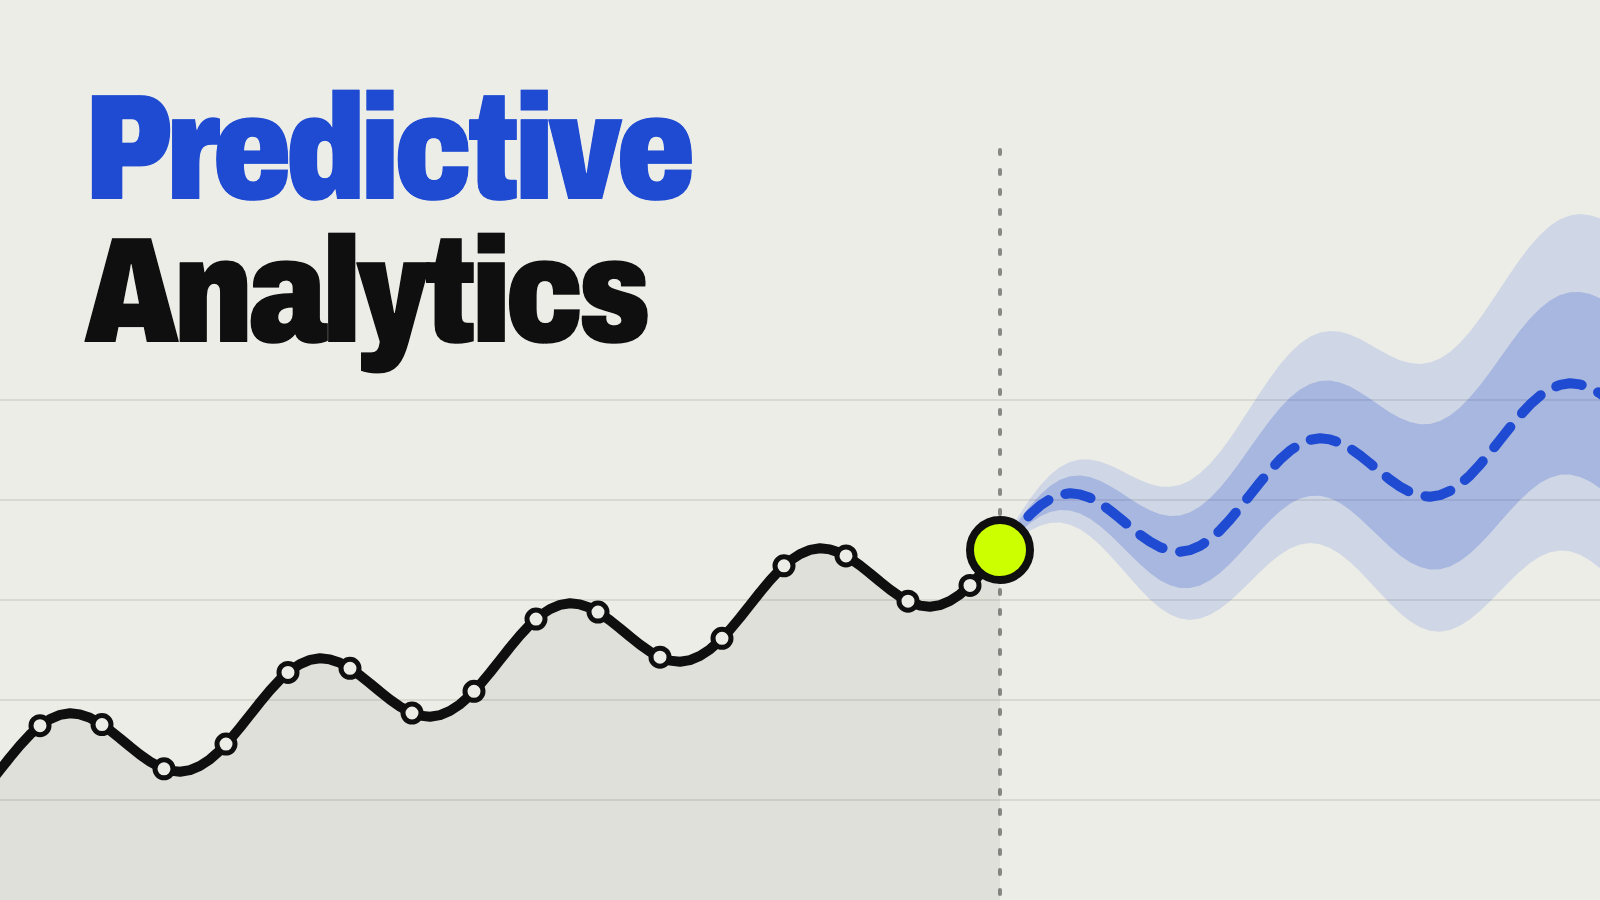
Predictive analytics uses historical data, statistics, and sometimes machine learning to estimate what’s likely to happen next — like future sales, customer churn, or equipment failure. Unlike a guess, a valid prediction is built on real data, tested against a simple baseline, and measured for accuracy before a business acts on it.
- Predictions are probabilities, not guarantees — a good one comes with a sense of its own error.
- A model is only worth using if it beats a simple baseline like “same as last month.”
- Test on data the model hasn’t seen, then keep measuring as conditions change.
- A chatbot’s confident sales number isn’t a forecast; it has no data, testing, or error estimate.
Predictive analytics in simple terms
Predictive analytics uses data about the past and present to estimate what’s likely to happen. It combines historical records, statistics, and sometimes machine learning with business judgment to produce a forecast, probability, or score that supports a decision. It’s the “predict” job on our list of the five things AI does in a business.
| Step | What happens |
|---|---|
| 1. Collect data | Sales records, customer behavior, sensor readings, transactions, weather — whatever fits the question |
| 2. Find patterns | Statistical models or machine learning find relationships between past conditions and outcomes |
| 3. Estimate an outcome | A forecast, probability, score, or category — for example, “68% likely to churn” |
| 4. Take action | Adjust inventory, contact a customer, schedule maintenance, change a price, or investigate |
| 5. Measure and improve | Compare what happened with what was predicted, and refine the model |
Weather forecasting is the familiar version. Forecasters look at historical patterns and current conditions to estimate the chance of rain. They don’t guarantee it; they report a likelihood based on how similar conditions played out before.
Predictions are probabilities, not guarantees. Reliability depends on data quality, how well the model is built, and whether the future resembles the past. Any legitimate model should come with a sense of its error rate or confidence range, not a single number presented as fact.
Descriptive vs. diagnostic vs. predictive vs. prescriptive analytics
One running example — a sales dip — shows the four types of analytics:
| Type | Question it answers | Example |
|---|---|---|
| Descriptive | What happened? | Sales fell 8% last month. |
| Diagnostic | Why did it happen? | A key product was out of stock. |
| Predictive | What’s likely to happen next? | Demand will probably recover once stock is back. |
| Prescriptive | What should we do? | Reorder now and run a targeted promotion. |
Descriptive and diagnostic analytics explain the past — the kind of reporting covered in our guide to AI business reports. Predictive analytics turns those patterns into an estimate of what’s coming, and prescriptive analytics recommends an action. A prediction alone doesn’t create value; it pays off only when it drives a timely, well-reasoned decision.
How predictive models are built and checked
Start with a baseline
A baseline is the simplest possible prediction: “next month will look like last month,” or “demand equals the historical average.” Forecasters call these benchmark methods. The standard forecasting textbook, Forecasting: Principles and Practice, notes that the naïve method — just repeating the last value — works remarkably well for many economic and financial series. That’s the point: a model is only worth using if it beats the baseline by a meaningful margin. If a sophisticated model can’t outperform “repeat last year,” it isn’t adding value.
Training, validation, and test data
Model builders typically split historical data three ways:
| Data set | Used for | Think of it as |
|---|---|---|
| Training data | Teaching the model patterns | Study material |
| Validation data | Tuning and comparing versions | Practice tests |
| Test data | A final, honest check on data the model hasn’t seen | The real exam |
A model that only does well on the data it learned from may be memorizing noise instead of a real pattern. Google’s machine learning course adds a useful warning: validation and test sets can “wear out” if you reuse them too often, so fresh data matters.
Measure the errors that matter
Raw accuracy can mislead when mistakes have different costs. A false positive flags something that isn’t a problem (blocking a legitimate payment as fraud); a false negative misses something real. Precision and recall capture the trade-off: precision is the share of flagged cases that were actually right, and recall is the share of real cases the model caught.
Hypothetical example #1: demand forecasting
A hypothetical example for illustration.
| Stage | What it looks like |
|---|---|
| Question | How many umbrellas will each store sell next week? |
| Inputs | Past umbrella sales by week and store, seasonal patterns, weather forecasts, promotions and prices, regional differences |
| Prediction | A demand spike at stores in the path of an incoming storm |
| Action | Order more umbrellas for those stores ahead of time — avoiding stockouts without tying up cash in stock that won’t sell |
| Validation | After the week, compare actual sales with the forecast and with the baseline (“same as last week” or “same week last year”) |
If the model consistently beats the baseline over time, it earns a place in planning. If it doesn’t, question whether the extra complexity is worth it.
Hypothetical example #2: customer churn
A hypothetical example for illustration.
A subscription business wants to know which customers are likely to cancel. Common warning signals:
- Declining product or app usage
- Failed or late payments
- More support tickets or complaints
- Less use of key features
- How long they’ve been a customer
The model scores each customer — say, “72% likely to cancel in the next 30 days” — and customers above a threshold get outreach: a support call, a tailored offer, or a plan change.
Validating it: hold back some flagged customers from outreach and track what happens. If flagged customers really do cancel at a higher rate than unflagged ones, the model is adding real predictive value, not noise dressed up as insight. This is often called holdout testing.
More business examples of predictive analytics
| Use | What gets predicted | Example or note |
|---|---|---|
| Recommendations | What a customer will want next | Amazon’s item-to-item collaborative filtering; Netflix calls its recommendation algorithms “at the heart” of its service |
| Predictive maintenance | When equipment is likely to fail | Uses vibration, temperature, and run-time data to repair during planned downtime |
| Fraud detection | The chance a transaction is fraudulent | Location, spending patterns, and transaction speed |
| Credit and insurance risk | Likelihood of repayment or a claim | Regulated: lenders must still give specific reasons for denials even when they use complex algorithms (CFPB) |
| Dynamic pricing | Demand at different prices and times | Common in airlines and hotels |
| Lead scoring | Which prospects are likely to buy | Website activity, company size, past engagement |
| Healthcare operations | Admissions and readmission risk | Supports staffing — never replaces clinical judgment |
| Energy demand | Consumption by hour and season | Usage history plus weather |
| Logistics | Arrival times and delays | Traffic, weather, routes, delivery history |
| Cash flow | Upcoming shortfalls | See how forecasting fits into AI in accounting |
Why a chatbot guessing your sales isn’t a validated forecast
Ask a general-purpose AI chatbot “What will my sales be next quarter?” and you may get a confident number. That’s not a forecast.
| A validated forecast has… | A chatbot’s guess usually has… |
|---|---|
| Your actual historical data | No access to your data unless you provide it |
| A baseline to beat | No comparison point |
| Testing on data it hasn’t seen | No backtesting against past outcomes |
| An error range or confidence interval | A single confident number |
| Ongoing monitoring for drift | No record of whether its past “predictions” came true |
A chatbot’s guess is generated text shaped by language patterns — the kind of confident-but-unsupported output NIST calls “confabulation”. For how these models work, see what generative AI is.
Where AI tools do help: summarizing model results, explaining them in plain language, drafting reports, and brainstorming which variables to test. And for a real, simple forecast, you may not need special software at all: Excel’s Forecast Sheet builds a forecast from your historical data with a confidence interval — the range where Microsoft says 95% of future points are expected to fall. Our worked data analytics example shows how to check AI’s math.
Try this: set up a forecast you can check
Use any AI assistant to walk you through the method — not to produce the numbers:
I want to build a simple, checkable sales forecast in a spreadsheet. Here's my data: [paste 24+ months of monthly sales — totals only, no customer details]

1. Describe any trend and seasonal pattern you see, and anything unusual (one-off spikes, missing months).
2. Explain how to make a forecast with Excel's Forecast Sheet (or Google Sheets) using this data, step by step.
3. Hold out the last 6 months. Tell me how to compare the forecast for those months against two simple baselines: "same as last month" and "same month last year."
4. Tell me how to judge whether the forecast beats both baselines, and what I should NOT conclude from it.

Do not invent any numbers or predict figures yourself — only describe the method and what to check.
Benefits and limitations of predictive analytics
Benefits: forecasting demand and revenue, fewer stockouts and less excess inventory, earlier fraud and risk detection, less unplanned downtime, better marketing and retention, more personalized service, and smarter staffing and logistics.
| Limitation | Why it matters |
|---|---|
| Poor data quality | Incomplete or biased data gives unreliable predictions, however clever the model |
| Historical bias | Models trained on biased past decisions can repeat them |
| Drift | Changing behavior or markets can make an accurate model unreliable — Google calls it concept drift |
| Correlation vs. causation | A pattern in the data doesn’t prove one thing causes another |
| False alarms and misses | Every model makes errors; weigh the cost of each kind |
| Privacy and security | Models often use personal, financial, or health data that needs consent and safeguards |
| Limited explainability | Some accurate models are hard to explain to a customer, regulator, or clinician |
Watch out
Before you act on any prediction, ask three questions: What baseline did it beat? How was it tested on data it hadn’t seen? What’s the error range? If nobody can answer, treat the number as a guess — and see how to measure an AI pilot before you spend money on it.
Your next step
Try a simple forecast this week
- Export at least two years of monthly sales from your accounting or point-of-sale system.
- Write down two baselines: “same as last month” and “same month last year.”
- Build a forecast with Excel’s Forecast Sheet, holding back the last six months.
- Compare the forecast and both baselines against what actually happened.
- Use the forecast only if it clearly beats the baselines, and recheck it every quarter.
Keep going
Business Prompted publishes practical guides, tool reviews, and workflows for people who run businesses. Explore more at businessprompted.com.
Common questions
What is predictive analytics in simple terms?
Using historical data, statistics, and sometimes machine learning to estimate what’s likely to happen next, like future sales or customer churn. The cycle: collect data, find patterns, estimate, act, and measure.
What’s the difference between descriptive, predictive, and prescriptive analytics?
Descriptive says what happened, diagnostic says why, predictive estimates what’s likely next, and prescriptive recommends what to do about it.
What are some real-world predictive analytics examples?
Demand forecasting, customer churn prediction, fraud detection, predictive maintenance, credit scoring, dynamic pricing, and product recommendations like Amazon’s and Netflix’s.
Is predictive analytics the same as AI or machine learning?
No. Predictive analytics is the goal — estimating future outcomes. Machine learning and statistics are techniques for reaching it, and many forecasts use simple statistical methods.
Can a chatbot accurately predict future sales?
Generally, no. Without your historical data, testing against past outcomes, and an error estimate, a chatbot produces a plausible-sounding guess, not a validated forecast.
How do you know if a predictive model is accurate?
Compare it against a simple baseline and against test data it hasn’t seen, then monitor it over time for drift. Weigh the cost of false positives and false negatives, not just overall accuracy.
Which tool is best for predictive analytics?
It depends on your data and needs. Options range from spreadsheet forecasting like Excel’s Forecast Sheet to business intelligence platforms and dedicated machine-learning tools.
Is predictive analytics only for large companies?
No. Small businesses can forecast sales, staffing, and retention with accessible tools, including the forecasting built into common spreadsheets.
Sources & further reading
- Hyndman & Athanasopoulos — Forecasting: Principles and Practice, ch. 5: The forecaster’s toolbox
- Google Machine Learning Crash Course — Dividing the original dataset
- Google Machine Learning Crash Course — Accuracy, precision, and recall
- Microsoft Support — Create a forecast in Excel for Windows
- Amazon Science — The history of Amazon’s recommendation algorithm
- Netflix Research — Recommendations
- CFPB — Circular 2022-03: Adverse action notices and complex algorithms
- Google — Machine Learning Glossary: concept drift
- NIST — AI 600-1, Generative AI Profile
A note on risk: Forecasts are estimates, not guarantees, and conditions and regulations vary. For decisions with significant financial, legal, or operational stakes — including credit, insurance, and healthcare — consult qualified professionals rather than relying on a model’s output alone.
Business Prompted guides are written for practical use and checked against the sources listed above. Read our editorial policy.